
Your latest fund updates, market insights and simple actions for the year ahead.
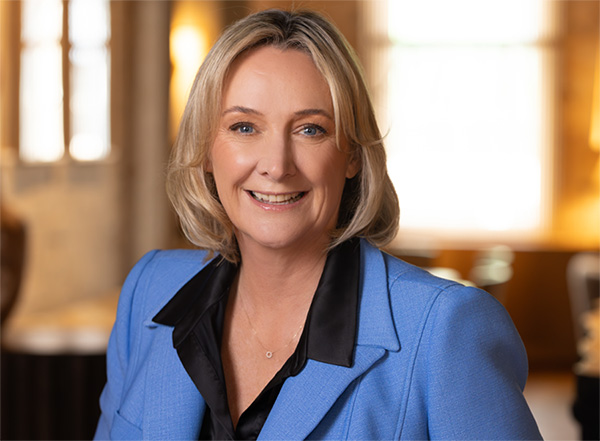
Kia ora koutou,
The second quarter brought no shortage of headlines.
Despite geopolitical tensions, changing interest rate expectations and periods of market volatility, investment markets delivered positive returns.
Markets will always change, but successful investing isn't about predicting the next headline. It's about following an approach that has stood the test of time. You don't need a large amount of money or years of investing experience to get started. By investing regularly and staying focused on your long-term goals, you can steadily build wealth over time.
Read more about what happened in markets last quarter in our latest market summary.
Ngā mihi nui,
Lisa Turnbull
CEO - Smart
Investing 101

A quick KiwiSaver check-up
Your KiwiSaver doesn't need constant attention, but it's worth reviewing as your life changes.
The fund that's right for you in your 20s may not be the best fit in your 50s, and even small changes to your contribution rate can make a meaningful difference over time.
Our guide explains the key things to review at every stage of your KiwiSaver journey.
Have any questions, we’re here to help.
To speak to our team, call us on 0800 27 87 37, email This email address is being protected from spambots. You need JavaScript enabled to view it., or fill out our contact form.

View your statements online anytime
In the SuperLife member portal you can view your account balances, update your personal details, check that your PIR is correct, and download statements and tax information.
Markets at a Glance
What’s moving markets - and what it means for you
Market commentary by Stuart Millar, Chief Investment Officer

The second quarter of 2026 was another reminder that markets don't move in a straight line.
Conflict in the Middle East created uncertainty early in the quarter, but a ceasefire and later agreement helped calm markets. Oil prices returned to pre-conflict levels, suggesting that markets view the disruption as temporary.
Despite ongoing geopolitical risks, the global economy, particularly the US, has remained resilient. Growth expectations have softened slightly, but the outlook for long-term investors remains positive.
The IPO of SpaceX, the largest on record, with a valuation approaching USD 2.25. trillion by quarter end, highlighted continued investor demand for innovation-led growth. This enthusiasm has also supported technology-heavy markets such as South Korea, up 101% year to date, and Taiwan, up 59% to 30 June 2026.1
After such strong gains, some technology shares are now trading at higher valuations. We continue to see value in maintaining diversified portfolios, including exposure to more defensive assets such as bonds.
Table 1: Major Asset Class Performance in NZD as at 30 June 2026.
| Asset class | Index | 3-month asset class return | 12-month asset class return |
|---|---|---|---|
| Developed Market Equities (Unhedged) | MSCI World ex Australia Net Total Return USD Index) | 15.05% | 30.45% |
| Developed Market Equities (Hedged) | MSCI World ex Australia Net Total Return 100% hedged to NZD DHED | 13.58% | 21.43% |
| Emerging Market Equities (Unhedged) | MSCI Emerging Markets Net Total Return USD Index | 25.30% | 54.06% |
| Australian Equities (Unhedged) | S&P/ASX 200 | 4.95% | 16.01%% |
| New Zealand Equities | S&P/NZX 50 Total Return Index | 5.50% | 8.08% |
| Global Infrastructure (Hedged) | FTSE Developed Core Infrastructure 50/50 100% Hedged to NZD Net Tax Index | 2.21% | 16.03% |
| Global Property (Hedged) | FTSE EPRA Nareit Developed ex Aus Rental 100% Hedged to NZD Net Tax Index | 9.53% | 13.59% |
| International Fixed Interest | Bloomberg Global Aggregate Total Return Index Hedged NZD | 0.99% | 1.68% |
| NZ Corporate Fixed Interest | NZ Corporate Fixed Interest S∓P/NZX A-Grade Corporate Bond Total Return Index | 2.47% | 5.10% |
| NZ Government Fixed Interest | S&P/NZX NZ Government Bond Total Return Index | 3.17% | 5.54% |
| NZ Cash | S&P/NZX Bank Bills 90-Day Total Return Index | 0.64% | 2.82% |
Returns are before fees and taxes. Past performance is not a reliable indicator of future performance. Source: Bloomberg.
Global Equities
Global equities delivered strong gains during the quarter, with the MSCI World Index returning 13.3%, supported by resilient economic growth, strong corporate earnings, and easing geopolitical concerns.
Inflation worries eased as tensions in the Middle East subsided and oil prices fell from a peak of $USD120 per barrel to $USD70per barrel.
As market confidence improved, the VIX Index (which measures expected share market volatility) fell from 25.3 to 16.5, signalling that investors were becoming less concerned about short-term market swings. Investors also became more confident that geopolitical tensions would not materially disrupt continued investment in AI infrastructure.
Key markets
- Emerging markets posted their strongest quarterly gain since 2009, advancing more than 24% and outperforming developed markets by over 13 percentage points.
- Strong gains in semiconductor companies were a major driver, particularly in Taiwan and South Korea, where technology companies make up a significant share of market indices.
- The Nasdaq-100 surged 27.5% during the quarter, outperforming broader markets, while the S&P 500 gained 14.9%. Continued enthusiasm around artificial intelligence, datacentres, semiconductors and cloud computing remained the primary driver of returns.
- Japanese equities represented by the Nikkei 225 rose an impressive 37.2% during Q2 and 39.2% YTD. Strong earnings growth, corporate governance reforms and continued global demand for technology exports supported performance.
- European markets also posted strong returns, with the DAX gaining 10.2% and the STOXX Europe 600 rising 10.1%. Improving economic activity, attractive valuations and supportive corporate earnings helped European stocks participate in the global equity rally.
- The New Zealand dollar advanced more than 4.0% before giving up these gains and finishing the quarter 0.8% lower resulting in similar returns from both hedged and unhedged global equities.
NZ & Australian Equities
The New Zealand stock market ended the second quarter of 2026 on a positive note. The S&P/NZX 50 Index delivered a total return of 5.5% for the quarter taking its year-to-date return to around 0.4%.
The quarter was shaped by a volatile backdrop, before improving geopolitical conditions and easing fuel prices supported a recovery through May and June.
Among the larger companies, Infratil (IFT) was a standout contributor, returning 37.8% for the quarter after securing Australia's largest-ever data centre contract. Mercury Energy (MCY, 11.5%), Meridian (MEL, 7.4%) and Skellerup (SKL, 24.5%) also delivered strong returns, supported by resilient earnings and continued investor demand for more defensive companies. A2 Milk (ATM, -17.9%) was a notable exception after lowering its earnings outlook due to supply chain disruptions. We expect conditions to improve as supply chains and confidence recover.
The Australian share market delivered a modest positive return during the second quarter, with the S&P/ASX 200 returning 1.9% to take its year-to-date return to 2.7%. Gains were uneven across the market. Materials and Consumer Discretionary were the strongest sectors, supported by recovering commodity prices and resilient consumer spending. Goodman Group (+19.1%) and Macquarie Group (+20.0%) were among the largest contributors to market returns.
Financial stocks supported the market early in the quarter, although bank shares came under pressure later after the government's budget introduced property tax reforms that prompted earnings downgrades across the sector.
Energy (−16.4%), Communications (−5.9%) were the weakest performing sectors. Among the larger companies, CSL (-19.3%), Westpac (-12.1%) and Woodside (-19.0%) were among the biggest drags on the market. Woodside was particularly affected as LNG prices fell after geopolitical tensions eased.
We continue to monitor how geopolitical developments and economic conditions influence market performance.
Cash
The RBNZ's latest forecasts reflect a more challenging economic outlook, with slower growth and higher inflation expected than previously forecast. While easing tensions in the Middle East have helped reduce oil prices and lower wholesale interest rates, inflation remains above the RBNZ's target.
Looking ahead, the RBNZ faces a difficult balancing act between bringing inflation under control and supporting economic growth. As a result, the outlook for interest rates remains uncertain and will depend on how the economy and inflation evolve over coming months.
NZ Fixed Interest
The June quarter was positive for New Zealand fixed interest markets. Easing geopolitical tensions reduced inflation concerns and bond yields declined. The 2-year New Zealand Government Bond yield fell 23 basis points during the quarter, while the 10-year yield fell 37 basis points.
Falling bond yields increased the value of existing bonds, helping fixed interest investments deliver positive returns alongside regular income. Over the quarter, the S&P/NZX New Zealand Government Bond Index returned 3.17%, while the S&P/NZX A Grade Corporate Bond Index returned 2.47%.
Why do falling bond yields help fixed interest returns?
When bond yields fall, existing bonds paying higher interest become more valuable, causing their prices to rise. This means bond funds can generate returns from both the income they receive and increases in the value of the bonds they hold.
Global Fixed Interest
Global bond markets also delivered positive returns over the quarter. Lower oil prices helped ease inflation concerns and supported bond prices. While investors now expect US interest rates to remain higher for longer than previously thought, global bond markets delivered positive returns during the quarter, with the Bloomberg Global Aggregate Index (NZD Hedged) returning 1.15%.
Looking Ahead
Looking ahead, markets will continue to respond to changing economic and geopolitical conditions. Short-term volatility is part of investing, but history shows that maintaining a diversified portfolio and taking a long-term approach remain the most reliable ways to build wealth over time.
1. Bloomberg

Make sure your contact details are up to date
Access your statements and tax certificates online - faster, safer, and all in one place. In the portal you can check your account balances, update your details, set up a direct debit and check if your PIR is right.
Log in to your member portal to update your details so we can send you important updates.
Fund performance
SuperLife KiwiSaver Diversified Funds as at 30 June 2026
The investment returns shown below are for the specified periods ended 30 June, for a SuperLife KiwiSaver Scheme member (after fund charges and before tax). The SuperLife Default Fund is only available to members of the SuperLife KiwiSaver Scheme.
SuperLife KiwiSaver Scheme – Investment Returns 30 June 2026
| 30 June 2026 | 31 March 2026 | 31 December 2025 | 30 June 2025 | 30 June 2023 | 30 June 2021 | 30 June 2019 | 30 June 2016 | |
| FUNDS | 1 MONTH | 3 MONTHS | 6 MONTHS | 1 YEAR | 3 YEARS (P.A) | 5 YEARS (P.A) | 7 YEARS (P.A) | 10 YEARS (P.A) |
|---|---|---|---|---|---|---|---|---|
| SuperLife Income | 0.77% | 1.73% | 1.15% | 3.12% | 3.68% | 1.22% | 1.78% | 2.38% |
| SuperLife Conservative | 1.01% | 5.07% | 3.22% | 8.37% | 7.39% | 3.75% | 4.36% | 4.92% |
| SuperLife Balanced | 1.25% | 8.57% | 5.34% | 13.68% | 10.67% | 5.86% | 6.80% | 7.25% |
| SuperLife Default | 1.66% | 8.97% | 4.93% | 12.10% | 10.10% | - | - | - |
| SuperLife Growth | 1.46% | 10.96% | 6.80% | 17.21% | 12.95% | 7.36% | 8.19% | 8.65% |
| SuperLife High Growth | 1.62% | 13.29% | 8.18% | 21.09% | 15.19% | 8.81% | 9.76% | 10.13% |
| Ethica | 1.55% | 8.47% | 4.76% | 13.24% | 11.09% | 5.99% | 7.75% | 7.50% |
(Note: These figures are representative of the SuperLife KiwiSaver Scheme. Returns displayed are after fund charges and before tax. Past returns are not a reliable indicator of future performance).
This information does not constitute financial advice and does not take account of personal circumstances; rather, it is designed to illustrate possibilities. As with all investment decisions, what might be the right strategy over the medium or longer term may not pay off over the very short term. No one can consistently predict what will happen over the short term. Those acting upon the information in this newsletter do so entirely at their own risk. Smartshares does not accept liability for the results of any actions taken or not taken based on this information. While every effort has been made to ensure accuracy, no liability is accepted for errors or omissions in this newsletter.
